1. Maximum Drawdown (MDD)
Definition
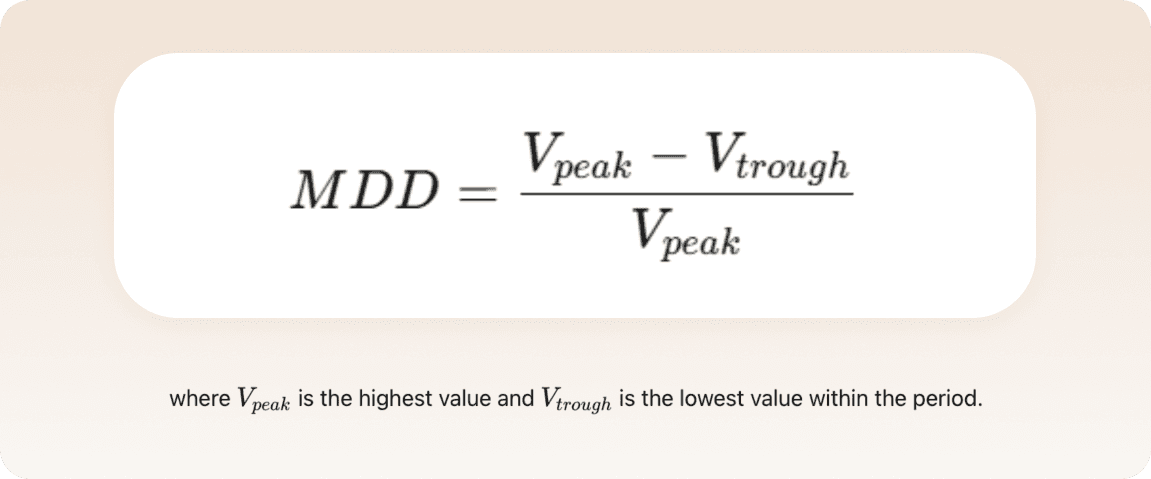
The largest percentage decline of a strategy from its highest value to its lowest value during a given period. This does not indicate a final loss, but rather interim fluctuations in value.
Interpretation
The lower the MDD, the better, as it indicates that the strategy has experienced smaller interim fluctuations or losses. A high MDD may point to a strategy that is vulnerable to significant drawdowns, implying a higher level of risk.
2. Maximum Drawdown Monthly
Definition
The largest percentage decline of a strategy within a single calendar month.
Interpretation
This measures the downside risk on a monthly basis. A low value indicates a stable strategy with limited fluctuations or losses within the month, while a high value may signal increased volatility and risk.
3. Annualised Return
Definition
The average annual return of a strategy, calculated based on historical data. This allows for a fair comparison between strategies with different durations.
Interpretation
A higher annualised return indicates a better-performing strategy. However, it is important to always evaluate this return in combination with risk indicators, such as standard deviation and drawdowns, to get a complete picture of the risk profile.
4. Annualised Standard Deviation
Definition
The annual standard deviation is a measure of the volatility of returns on a yearly basis. Standard deviation measures how far individual returns deviate on average from the mean return. The greater this deviation, the higher the volatility.
Interpretation
The higher the annualised standard deviation, the more volatile the strategy and the less certain the future returns. A low standard deviation indicates a more stable and predictable strategy.

5. Standard Deviation Monthly
Definition
The standard deviation of monthly returns indicates how much the monthly returns deviate from the average monthly return. It is a measure of volatility on a monthly basis.
Interpretation
A high standard deviation means that monthly returns fluctuate significantly. This may indicate a high-risk strategy, while a low value suggests more stable performance.
6. Downside Deviation
Definition
Downside deviation measures the dispersion of negative returns below a certain threshold (e.g. 0% or the risk-free rate). Unlike standard deviation, this metric focuses solely on downward movements, providing a more targeted view of downside risk.
Interpretation
The lower the downside deviation, the more limited the strategy’s downside risk. This is especially relevant for investors who prioritise capital preservation and avoiding negative returns.
7. Sharpe Ratio
Definition
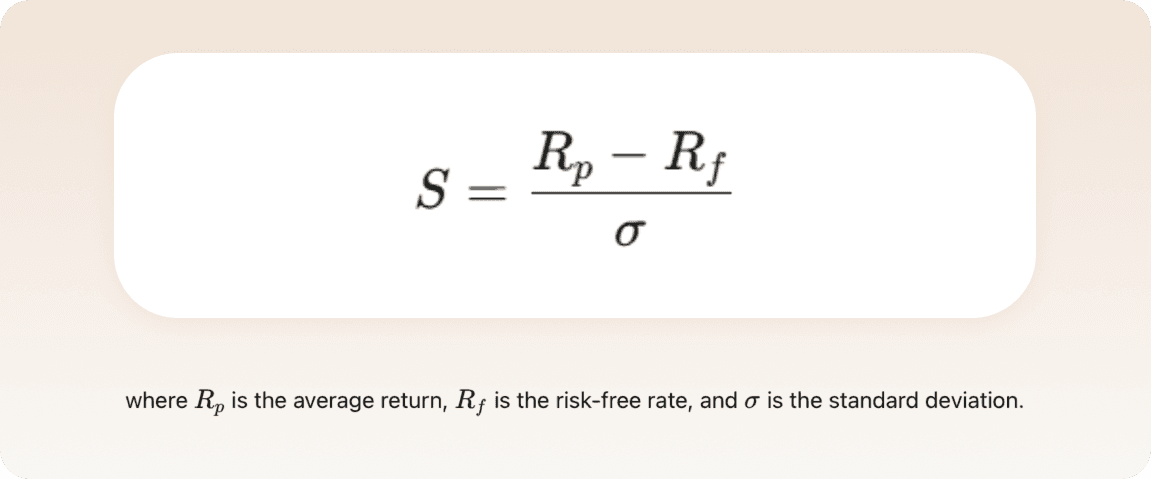
The Sharpe Ratio measures how much excess return a strategy generates per unit of risk, where risk is expressed as volatility (standard deviation). It compares the excess return over the risk-free rate to the volatility of the strategy.
Interpretation
The higher the Sharpe Ratio, the more efficiently a strategy generates returns relative to the risk taken.
Sharpe > 1: good
Sharpe > 2: excellent
Sharpe < 1: relatively low risk-adjusted return
8. Sortino Ratio
Definition
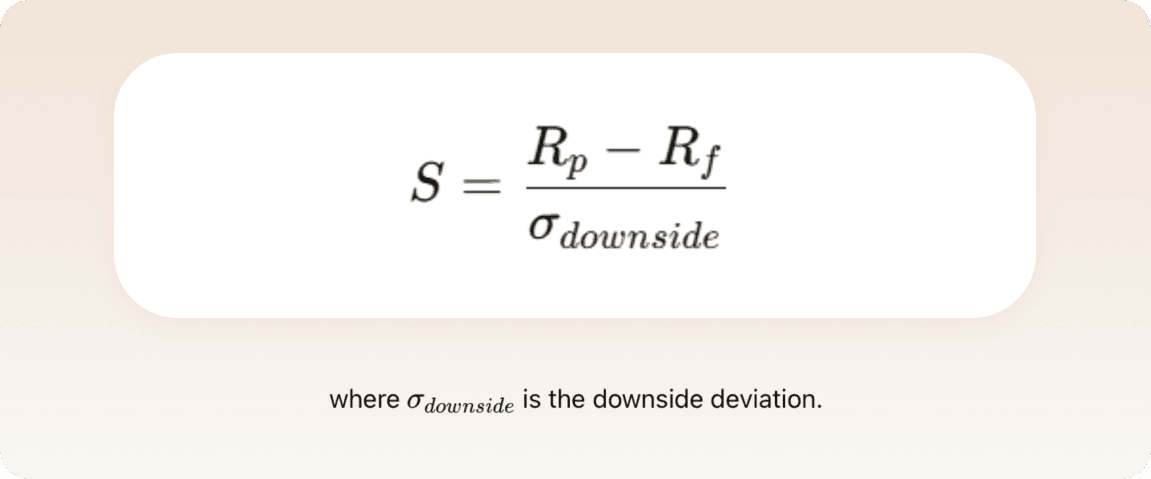
The Sortino Ratio is a refinement of the Sharpe Ratio and measures return per unit of downside risk. Instead of using total volatility, this ratio considers only downside deviation, specifically focusing on the risks investors seek to avoid.
Interpretation
The higher the Sortino Ratio, the better the strategy performs relative to its downside risk. A low or zero value of the downside deviation (e.g. no negative months) results in a Sortino Ratio of 0, as there is no measurable downside risk in that case.
9. Skewness
Definition
Skewness is a metric that indicates whether the distribution of returns is asymmetrical — that is, whether the data leans toward positive or negative outliers relative to the mean.
Interpretation
Positive skewness (> 0): More extreme positive returns. This can be favorable for investors.
Negative skewness (< 0): Greater likelihood of sudden large losses, indicating a less favorable risk profile.
Skewness ≈ 0: A symmetrical distribution of returns, with no clear skew to either side.
10. Kurtosis
Definition
Kurtosis measures how extreme the outliers are in a distribution of returns. It provides insight into the "thickness" of the tails, meaning how often very large or very small returns occur compared to a normal distribution.
Interpretation
High kurtosis (> 3): More and more extreme outliers than normal (fat tails).
This may indicate increased risks, such as unexpected large losses or gains.
Low kurtosis (< 3): Fewer outliers, which may suggest a more stable strategy.
Kurtosis ≈ 3: Corresponds to a normal distribution, with an average level of outliers.
